The 2022 midterm elections have proven once more how much the California Citizens Redistricting Commission has failed to live up to its mission: drawing fair maps.
In 2022, Democratic House candidates in California won 63% of the state’s popular vote but 77% of California’s House seats. The California Citizens Redistricting Commission, approved by voters in 2008 and 2010, was created with the goal to draw fair maps. However, since 2012, the first Congressional election using the Commission’s maps, “Difference”—the gap between political parties’ popular vote share and seat share—has only increased.
Chart 1: “Difference” for CA State Assembly, CA State Senate, CA House Since 1992
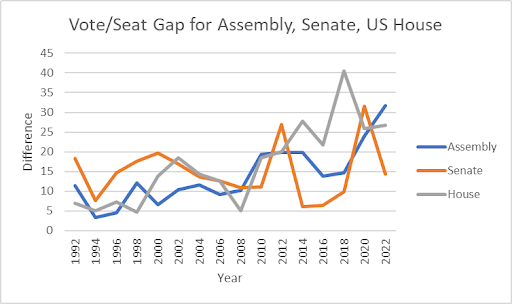
In fact, the “Difference” between California’s House Delegation and State Assembly (but curiously not for the State Senate) has steadily increased since 1992. In the 2022 California State Assembly election, Democrats won approximately 61% of the popular vote, but nearly 78% of California’s Assembly seats. This has real-life consequences for governance since supermajorities are required to pass Constitutional amendments and raise taxes. If California Republicans had fair representation in their legislature, they would be powerful enough to check the Democratic Governor and the Democratic legislature.
Why isn’t the California Independent Redistricting Commission drawing fair maps?
Although party affiliation remains one of the best predictors of voting behavior, the commission does not even consider it. In accordance with the California Constitution, the Commission prioritizes these five factors:
- “Population equality” (every district has approximately equal population)
- Enough majority-minority districts (districts whose population is majority non-white)
- “Geographic contiguity” (all parts of a district are connected to each other)
- “Geographic integrity” (district lines don’t cut through cities, counties, neighborhoods, and “communities of interest”)
- “Geographic Compactness” (the district is a solid shape, not all over the place)
Party affiliation is only allowed to be considered so the maps do not unfairly benefit one party. Otherwise, the Commission cannot consider party affiliation. How can the Commission draw fair maps without taking into account one of the best predictors of voting behavior available?
Some might argue that the increased “Difference” is because the California Democratic Party has become hegemonic over the past few decades, not because the maps are unfair. In the 1980s, Democrats and Republicans competed for the California coast. No longer. In the 1980s and 1990s, Republicans controlled the Inland Empire. No longer. Orange County was once a conservative stronghold. No longer. Simply put, Democrats have blanketed California and therefore it could be nearly impossible to draw fair maps for Republicans. To test this, I used DistrictBuilder to draw my own Congressional map for California, shown here:
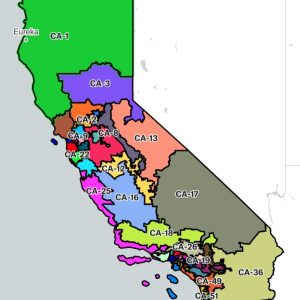
Here’s the Bay:
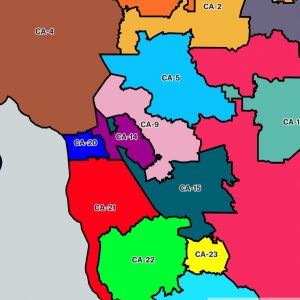
And LA:
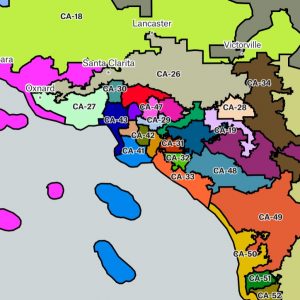
This map includes 34 Democratic-lean districts (65% of the seats), 17 Republican-lean districts (33% of the seats), and one true toss-up race. This is a much fairer partisan map for Republicans. I was only able to draw it by violating many key priorities of the Commission, namely by breaking up counties, towns, cities, and communities of interest, and not prioritizing the creation of majority-minority districts. I call this “equitable gerrymandering,” actively drawing district lines to help minority political groups have fair representation. Fair maps are possible—they’re just currently illegal.
With that, the correlation between the Democratic popular vote margin of victory and “Difference” is moderate at best. The changes in “Difference” for California House races may be more reflective of the recent history of California redistricting. In 1980, the Democratic legislature and Democratic Governor Jerry Brown drew heavily gerrymandered maps, which were used in the 1982 election but then overturned by voters in a GOP-led referendum. Democrats and Republicans worked together in a bipartisan gerrymander, also known as an incumbent gerrymander, to protect incumbents, for Congressional elections from 1984 to 1992. In 1990, the Democratic legislature and Republican Governor Pete Wilson could not come to a deal on redistricting, so the courts drew the maps used in the 1990s. In 2000, Democrats and Republicans came together again to do a bipartisan gerrymander. Since 2012, the Commission’s maps have been used.
Others may maintain that increasing “Difference” and Democratic overrepresentation are due to chance. The argument posits that although Democrats won 63% of the vote in 2022, they managed to win a slight majority in enough competitive districts to win 77% of the seats. Going into the 2022 election, California’s House map contained 43 Democratic-leaning seats, meaning Democrats had an advantage in over 82% of California’s House seats. Therefore, it is not due to random chance that in 2022, Democrats won nearly 77% of the seats. Furthermore, with the exception of 2016, the “Difference” in the California House races and the California State Assembly has been steadily increasing. If the “Difference” was determined by chance, there would be no noticeable upwards trend; it would spike and crash at random. Finally, California House Democrats have won ten percentage points more seats than the popular vote for 7 straight elections going back to 2010. It is very unlikely that such a wide discrepancy is Democratic dumb luck.
California’s redistricting commission is most similar to Arizona’s, which has produced much greater partisan fairness than California.
Table 1: Large States with Independent Redistricting Commissions, 2012 to 2022
| State | Average Difference |
| Arizona | 12.19 |
| California | 27.11 |
| Washington | 18.87 |
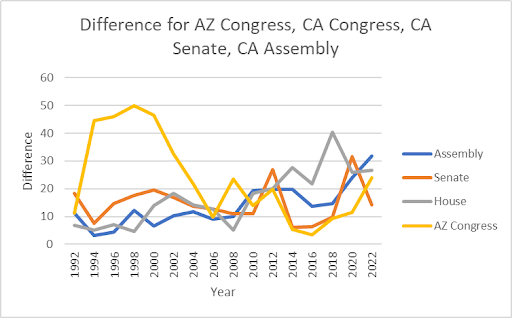
However, partisan unfairness has been increasing in Arizona too:
Chart 2: “Difference” for AZ Congress, CA State Assembly, CA State Senate, CA House since 1992
All that being said, the California Citizens Redistricting Commission has eliminated the appearance of corruption by taking redistricting power away from California politicians, which can work to decrease voter cynicism. Moreover, nationwide, maps drawn by independent redistricting commissions have had a lower efficiency gap than those drawn by politicians. The efficiency gap is a metric often used by courts to measure gerrymandering by calculating the extent to which politicians diluted the political power of voters from the other party. Furthermore, compared to other large states from 2012 to 2022, California’s partisan fairness was average. For all states with eight or more Congressional districts in that period, the average “Difference” was 26.53. For California, it was 27.11. Independent redistricting commissions as a whole (also used in Arizona and Washington state) had an average Difference of 18.34. For states whose Congressional districts were drawn by partisan legislatures, the average was 33.14. Maps drawn by state and federal courts were the fairest. This was also true in California; the maps drawn by the courts in 1990 were the fairest of any recent decade.
Table 2: Average Difference Per Redistricting Method For Large States, 2012 to 2022
| Method | Average Difference |
| State or Federal Court | 15.76 |
| Independent Redistricting Commission | 18.34 |
| Politician Commission | 27.88 |
| Legislators (Split Party Rule) | 32.59 |
| Legislators (One-Party) | 33.14 |
The point is not that the Commission should be eliminated. Despite their visible flaws, the maps drawn by independent redistricting commissions nationwide have proven to be much fairer than maps drawn by legislators. Representative democracy demands maps to best represent voters’ beliefs and priorities, which are highly associated with party preference. On this front, the California Citizens Redistricting Commission is failing miserably. The Commission could be strengthened to consider party identification and implement “equitable gerrymandering” so they can actually fulfill their mission to draw maps better and more fairly than politicians can or ever will.
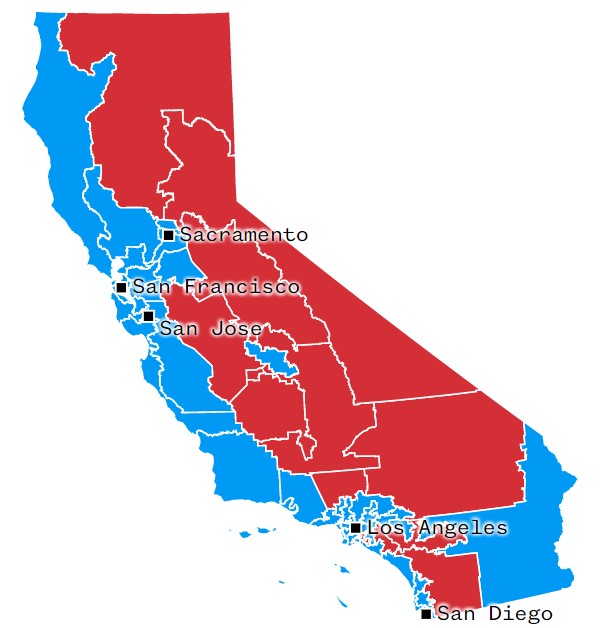
Featured Image Source: NBC News
Comments are closed.