What a success story for California!
After decades of Democrats and Republicans in the state legislature rigging Congressional maps through gerrymandering, citizens finally came together in 2008 to pass Prop 11, and in 2010 to pass Prop 20, putting redistricting in the hands of a bipartisan citizen commission. Once and for all, California had fair Congressional maps that accurately reflected Californians. Right? NOPE. Wrong.
A little backstory: there are 435 members in the U.S. House of Representatives, and thus 435 House districts in the United States. Each state is allotted a certain number of representatives based on population size, which is calculated every ten years following the decennial Census. California has 52 representatives, while for instance, Ohio has 16 and Oregon has 5. Once states know how many representatives they have, it is up to them to draw the district lines for these representatives, ensuring that each district has roughly the same amount of people. Gerrymandering is the practice of drawing district lines to give your party or yourself an unfair advantage.
Let’s imagine two electoral systems. In the first one, the Democratic Party’s candidates win 66% of the statewide vote, and they subsequently win 66% of the state’s Congressional seats. In the second system, the Democratic Party’s candidates win 66% of the vote, but end up winning 79% of the seats. Which system seems more fair to you?
Obviously, the first system. Yet, we currently live in the second system with its mind-bogglingly lopsided results. In 2020, Democratic candidates indeed won 66% of the vote, but won 79% of California’s Congressional seats. Meanwhile, Republicans won 34% of the vote, but only 21% of the seats. This is way out of proportion, undermining our representative democracy as a result. In a representative democracy, our elected officials should accurately represent the entire population’s views. 2020 was not even the most egregious example. In 2018, Democratic House candidates in California won 66% of the vote as well, but 87% of the seats—this is a serious problem. In fact, that was the main reason the California Citizens Redistricting Commission was created: to draw Congressional maps that don’t favor one party over another.
But that has simply not happened. The table below shows what percent of the vote and seats each party received in every Congressional election in California since 2002. For example, in 2008, Democratic candidates won 59.9% of the House votes in California, and 34 seats, which is 64.15% of California’s then-53 Congressional seats. Ideally, if Democrats won the same percentage of the seats as they did the statewide vote, they would have won 32 seats. Pay special attention to the “Difference” column, which for all intents and purposes is a measure of fairness. The higher the number, the less representative California’s Congressional delegation is of the will of the people.
| Year | Democrat Vote % | GOP Vote % | Dem Seats | GOP Seats | Dem Seat % | GOP Seat % | Difference | Ideal # of Dem Seats | Ideal # of GOP Seats |
| 2020 | 66.27 | 33.73 | 42 | 11 | 79.25 | 20.75 | 25.95 | 35 | 18 |
| 2018 | 65.74 | 32.61 | 46 | 7 | 86.79 | 13.21 | 40.45 | 35 | 17 |
| 2016 | 62.31 | 36.89 | 39 | 14 | 73.58 | 26.42 | 21.75 | 33 | 20 |
| 2014 | 58.91 | 39.49 | 39 | 14 | 73.58 | 26.42 | 27.75 | 31 | 21 |
| 2012 | 60.57 | 37.12 | 38 | 15 | 71.70 | 28.30 | 19.95 | 32 | 20 |
| 2010 | 53.39 | 43.5 | 34 | 19 | 64.15 | 35.85 | 18.41 | 28 | 23 |
| 2008 | 59.9 | 36.65 | 34 | 19 | 64.15 | 35.85 | 5.05 | 32 | 19 |
| 2006 | 53.05 | 37.41 | 34 | 19 | 64.15 | 35.85 | 12.66 | 28 | 20 |
| 2004 | 53.54 | 43.28 | 33 | 20 | 62.26 | 37.74 | 14.27 | 28 | 23 |
| 2002 | 51.28 | 45.14 | 33 | 20 | 62.26 | 37.74 | 18.39 | 27 | 24 |
The California Citizens Redistricting Commission began drawing maps after 2010. The “Difference” score is on average higher after 2010 than before. In short, the maps have become less fair even after the change we made a decade ago to make them fairer.
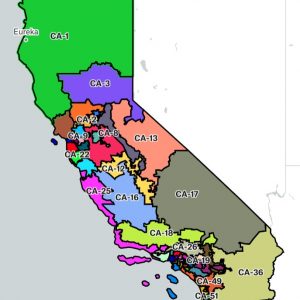
All of this becomes even more obvious when you look at the most recent Congressional map the commission drew for the 2022 elections. Here it is:
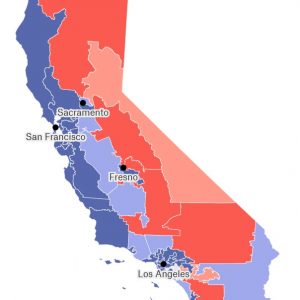
Out of California’s 52 districts, there are only eight that have any Republican-lean. That’s despite the fact that Republicans are 34% of the state, according to the 2020 election results. 34% of 52 is 18, so if we are to adhere to the principle of representative democracy, around 18 districts should have a Republican majority. But, there are only eight.
How did we get to this point? It’s not that Democrats control the commission. There are equal numbers of Democrats and Republicans on the commission, and this new map was approved unanimously, 14-0. The problem is that the commission’s priorities are wrong. When drawing Congressional maps, according to the California Constitution, the commission prioritizes five things in this order:
- “Population equality,” meaning every district has approximately the same number of people
- Enough majority-minority districts (districts whose population is majority non-white)
- “Geographic contiguity,” meaning a district forms one shape, not a bunch of unconnected pockets
- “Geographic integrity,” meaning district lines don’t cut through cities, counties, neighborhoods, and “communities of interest” (groups of people with similar interests)
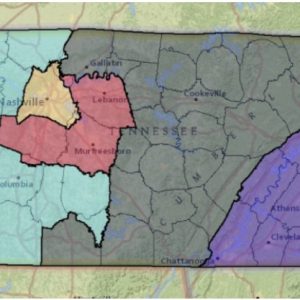
- “Geographic Compactness,” meaning a district is a solid shape, not all over the place
This is an example of high geographic compactness since the districts form tight shapes that keep nearby places together.
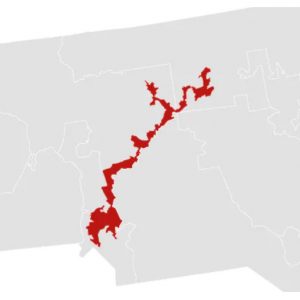
This district has low geographical compactness since it is scattered all over the place.
Within these priorities, party affiliation is not considered. The party that a person supports gives a good idea of their beliefs, so it seems like something that should be considered when drawing district lines. However, the commission focuses instead on drawing districts that don’t look funky.
I decided to make my own Congressional map to see if a fair map could be conceived, and here it is:
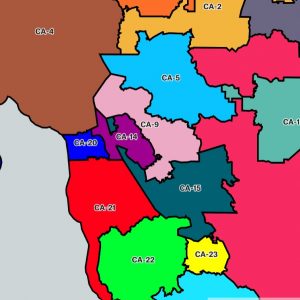
Here is a close-up of the Bay:
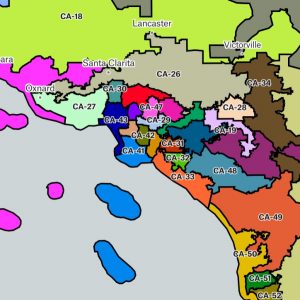
Here is a close-up of Southern California:
The districts are not in neat shapes, and they break up many cities, counties, neighborhoods, and “communities of interest.” There are 34 districts with a Democratic lean (65% of seats), 17 districts with a Republican lean (33% of seats), and one that is a true toss-up. Despite how unkempt this map looks on its face, it is far fairer than the one-sided map the California Citizen Redistricting Commission approved.
Some people may look at this approach to redistricting and first say that it is bad because it lumps places that have seemingly nothing in common into the same district. For example, District 11 includes the outskirts of Sacramento and goes down to Fresno. Another example is District 25, which goes from Santa Cruz to Santa Barbara down the California coast. How can we justify putting people who have seemingly nothing in common in the same district?
This question operates under the assumption that Americans vote based on issues. It assumes that when preparing to vote, Americans think about a bunch of issues that matter to them (which could be related to where they are from), and pick the candidate or party that aligns best with their views on those issues. However, there is actually little evidence that most Americans vote this way. Sure, Americans that are very engaged in politics will take this approach to voting, but this is such a small portion of the public. Based on what we know, most Americans don’t have firm opinions on most issues; their opinions change all the time. Also, most Americans are not informed enough to take this comprehensive approach to figure out who to vote for.
Americans vote for candidates for a whole bunch of reasons that have nothing to do with issues: many voted for JFK because he was handsome, many voted for Bill Clinton because he played the saxophone, and many voted for George W. Bush because he seemed folksy. Many Americans simply vote for a party because that’s the party they grew up supporting and from there they began to lean one way or another on certain issues. It doesn’t make sense to prioritize keeping communities together at the expense of partisan fairness because people don’t seem to vote because of any key issues that are particular to that community. Who people vote for is most correlated with partisan affiliation, not race, sex, gender, socioeconomic status, religion, or any key issue.
Some might object to the method I used to draw my map—a method I call “equitable gerrymandering”—because the districts just look funky. Even if the commission’s map is better looking, that does not mean the quality of the map is better. The fanciest car is not always the best car.
In making my map, I crammed as many Democratic voters into as few districts as I could, creating very concentrated Democratic districts. I did this so there would be enough Republicans remaining to distribute them over enough districts to get a Republican advantage in 17 of them. Some argue that this approach exacerbates partisan polarization. Partisan polarization is the extent to which the Democratic Party and the Republican Party move further and further apart on issues, with the Democratic Party moving left and the Republican Party moving right.
The argument goes that creating districts with heavy partisan leanings encourages the representatives of those districts to disregard the wishes of the opposing party and focus on winning their base for re-election. Thus, the policies they champion are more extreme on the left or right than if they had to appeal to members of the other party as well. The more one-party districts that are created, the greater the incentive for party leaders to cater only to the base.
While this is a logical theory, there is actually no evidence for it. If this theory were true, party polarization would increase after new districts are drawn (2012, 2002, 1992, 1982, etc.). But in fact what we see is that partisan polarization has increased steadily since the mid-1970s, not increasing after the turn of the decade. Next, the U.S. Senate has also experienced large party polarization, even though the Senate is not redistricted at all. Gerrymandering has existed since near the beginning of the Republic, but partisan polarization in the modern history of the United States has only increased beginning in the mid-1970s.
So what are we going to do about the problem with the California Citizen Redistricting Commission? In normal times, I would offer to place another ballot initiative before Californians, one which says that the California Citizen Redistricting Commission cannot produce maps that give one party an unfair advantage. It would create another criterion the commission would need to consider when drafting maps: that to the furthest extent possible, parties have an advantage in as many seats as is proportional to the popular will. However, we must really ask ourselves if we are interested in making this map fairer for Republicans in California. Some argue that doing so would harm democracy long-term. So, the debate rages on.
Featured Image Source: CalChamber


Comments are closed.